While eligibility assessments are the starting point for the first checks on the feasibility of Afforestation, Reforestation, and Revegetation (ARR), Reducing Emissions from Deforestation (REDD+), Improved Forest Management (IFM) and Blue Carbon projects according to the carbon methodologies, long-term viability is what determines their success. Remote Sensing (RS) technologies are an essential tool to assess non-permanence risks and make sure forest carbon projects are built to last.
The eligibility assessment of a project typically relies on satellite imagery and existing land cover datasets to evaluate whether a site meets the methodologies’ criteria. These tools help identify suitable areas, detect changes in land cover, and monitor land use over time.
Different challenges can jeopardize carbon projects’ permanence. Climate change increases risks of wildfires, droughts, floods, and extreme and unpredictable weather patterns that threaten ecological benefits and associated financial investments. Terrain characteristics such as steep slopes or poor accessibility can complicate restoration and conversation activities, making it difficult to implement properly the project. These examples highlight the need for reliable, scalable monitoring tools that can evaluate landscape resilience over time.
In a nutshell, Remote Sensing helps answer one important question: Can the land sustain carbon permanence not just today, but decades into the future?
While a certain area may meet the eligibility requirements for a forest carbon project, it may still be exposed to climate-related vulnerabilities. As part of the non-permanence risks of the project, it is essential to include the detailed analysis of the possible natural risks within the project area.
Remote sensing allows project developers to go deeper—analysing multi-year datasets to spot patterns in precipitation, temperature, and vegetation trends. This helps identify whether a location is experiencing increasing drought stress or shifting toward conditions unsuitable for forest growth.
For instance, temperature projections can highlight future thermal stress, while flood risk can be assessed by identifying patterns based on historical data. RS also helps quantify wildfire risk by mapping historic burn events and their intensity. Importantly, wildfires carry the greatest potential for immediate loss, making it essential not only to map past fire activity but also to integrate future climate projections. Anticipating how rising temperatures may amplify fire frequency ensures that project developers design strategies to mitigate this dominant risk. By combining these climate and environmental indicators, forest carbon projects can build a data-driven foundation for selecting resilient sites and designing adaptive, forward-looking strategies.
Beyond environmental risks, the physical terrain of a project area plays a critical role in the practicality of maintaining a forested area. Using technologies like DEMs (Digital Elevation Models), RS offers a detailed terrain analysis that can highlight slope, elevation and accessibility.
Steep slopes may lead to higher erosion risk and difficulty in planting or accessing the area for maintenance and monitoring, while high-altitude areas may experience more extreme weather variations, influencing tree growth. RS can also help map roads and closeness to infrastructures, supporting cost-effective project planning and monitoring.
Together, these factors can help evaluating not just if a project can be implemented, but whether it’s likely to succeed long-term.
In the Mount Kei Reforestation project, located in northern Uganda, hummingbirds use RS data to assess the natural risks related to carbon non-permanence. This includes the evaluation of erosion, thermal stress, drought, floods and wildfire risks.
Erosion risk is primarily determined by terrain slope, which is derived from elevation data (DEM).
By calculating the area and the percentage within each class (based on FAO’s classification), we can estimate erosion risk. Since steep slopes lead to a higher erosion risk, flatter terrain is associated with a lower risk. Based on the elevation map (Figure 1) and knowing that more than 90% of the project area falls within the flat to gentle slope category, erosion risk can be considered low.
The terrain slope is an essential variable to consider, especially to better plan the areas of intervention. Understanding slope dynamics not only guides where the interventions will be the most effective, but also inform us on operational decisions such as whether machinery can access the area, how infrastructures should be laid out, and what level of maintenance effort will be required.
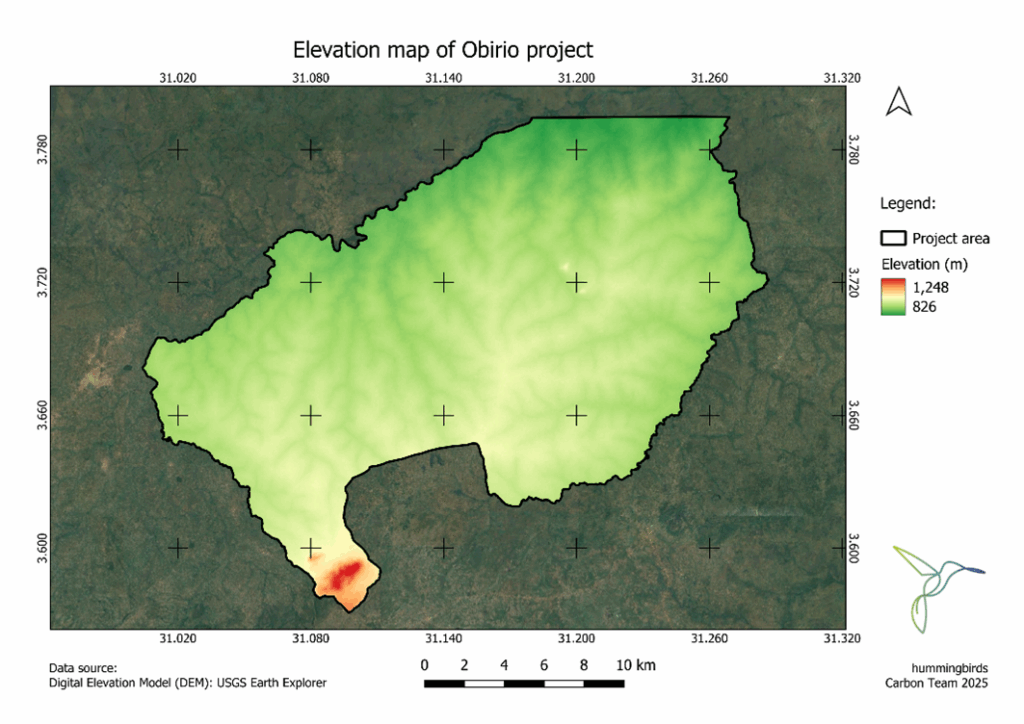
Figure 1 – Elevation map of the project area
Thermal stress risk is determined by the number of days in a year when temperatures exceed a determined threshold that may be harmful to plants. This insight supports species selection, favouring tree varieties more resilient to heat stress, as well as insights on the optimal planting windows to optimize survival rates.
For this analysis, we employ temperature projections based on five different climate models. Figure 2 depicts the probability that each day in 2050 will experience extreme heat, as predicted by the models. A value of 1.0 (dark red) indicates that all models predict temperatures above 35ºC for that day, whereas 0.0 (light yellow) means none of the models do. This heat map provides insight into the likely seasonal distribution of extreme temperatures events, allowing for proper planning and execution of climate adaptation and mitigation strategies.
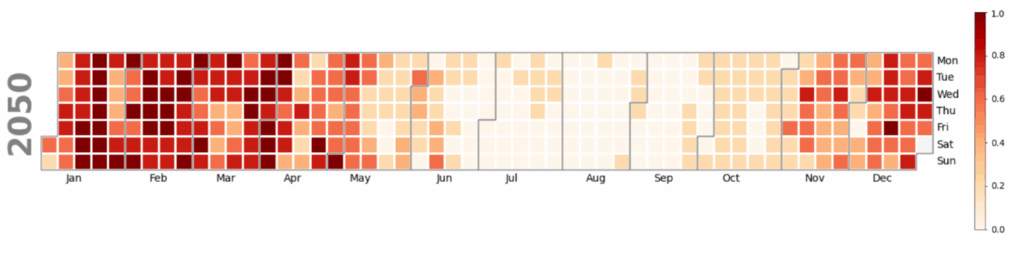
Figure 2 – Heat map of temperatures above 35ºC in 2050, in the project area
We evaluate flood risk using data from the Global Flood Database. This assessment distinguishes between actual flooded areas within the past years and permanent water bodies, ensuring that standing water features are not misclassified as flood events. In our example, since the area has experienced no floods during the period analysed, flood risk is considered low.
Drought risk is assessed using the Standardized Precipitation-Evapotranspiration Index (SPEI) over the past 20 years. This is a widely used metric that considers precipitation and potential evapotranspiration. By capturing how much water comes in and how much is used up, the index provides a clear picture of when and where drought conditions are developing, as well as their intensity and duration. The proportion of months experiencing severe to extreme drought is calculated, along with the number of years since the last drought event. Based on this analysis, the project is also classified as having a low drought risk.
Finally, to evaluate wildfire risk, we use as proxies the annual burned area per year over the past 24 years, and the number of major fire events within the project boundaries. We also analyse fire occurrence data in a 10-km buffer around the project to assess the risks of fires reaching the area from outside.
To address wildfire risk, establishing firebreaks and maintaining clean, fuel-free zones are essential strategies to prevent and manage potential fire outbreaks, complemented by measures such as community awareness campaigns, training of local fire brigades and early warning systems to ensure rapid response when threats arise.
While RS has become an essential tool in the long-term monitoring of forest carbon projects, it comes with limitations that must be acknowledged and addressed to improve reliability and precision. Some key challenges include:
However, Artificial Intelligence and Machine Learning are being increasingly integrated to analyse RS data more accurately and forecast future risks. Satellite technologies -such as hyperspectral imaging and higher-frequency revisits – are expected to offer more granular and timely data, making it easier to track forest health, detect early warning signs, and optimize interventions.
Eligibility is just the beginning. For forest carbon projects to truly make a climate impact in carbon mitigation, they must be resilient over decades. Remote Sensing supports developers in planning smarter, responding faster, and building projects that last.
Equally important is the scientific rigor behind the models we use. At hummingbirds, we ensure that our assessments are grounded in the most up-to-date information available, drawing from multiple datasets and platforms to cross-validate results.
As technology continues to improve, the integration of these approaches with advanced monitoring tools will make the long-term viability of forest carbon projects not only more measurable, but also more reliable. In this way, technology’s role in safeguarding permanence and strengthening the credibility of forest carbon projects will only grow more essential.
If you are interested in learning more about how hummingbirds’ team can support project developers in assessing non-permanence risks, please do not hesitate to contact us!