
Reforestation projects hold incredible promise in combating climate change, but the question of how much carbon they can sequester often feels like chasing shadows. With the rising prominence of ARR (Afforestation, Reforestation, and Regeneration) projects in the Voluntary Carbon Market (VCM), reliable methods to forecast carbon credits accurately are needed. Getting these estimates right is essential, not only to secure project funding but to ensure that these initiatives deliver real, measurable climate benefits.
When developing such types of projects, we always face the same question: how much carbon will the forest sequester over the project’s lifetime? In other words: how many carbon credits will the project generate?
This question is extremely important, as many ARR projects, including forest restoration ones, rely solely on carbon finance to fund their implementation. Other projects, such as agroforestry or timber plantations, might have other sources of revenue as well, but carbon finance presents an important portion of income for such projects, both in the implementation stage, as well as in the long-term. When estimating carbon from reforestation projects, we need to consider three key elements:
In this post, we break down four common methods used to estimate carbon credits generation from biomass in ARR projects, along with their advantages and disadvantages. Understanding these methods – and their uncertainties – is key to ensuring realistic and reliable estimates, especially at early stages.
Yield tables are an extremely valuable tool for forest management. In short, they provide information about how much a forest stand will grow over time, according to the quality of the area, and based on management practices, such as thinning.
For carbon estimations in a reforestation project, yield tables are the dream of every forester, as they provide a quite accurate representation of a (usually monospecific) forest stand, including mean diameter and height as well as the overall stand productivity (m3/ha/year) and cumulated volume (m3/ha).
With the volume in cubic meters, it is quite simple to transform it to carbon and then to tonnes of CO2 equivalent, the metric used in carbon credits (step-by-step guide).
An example of yield table (retrieved from Nunifu & Murchison, 1999) is presented below and represents the growth of Tectona grandis (teak) plantations in Northern Ghana.
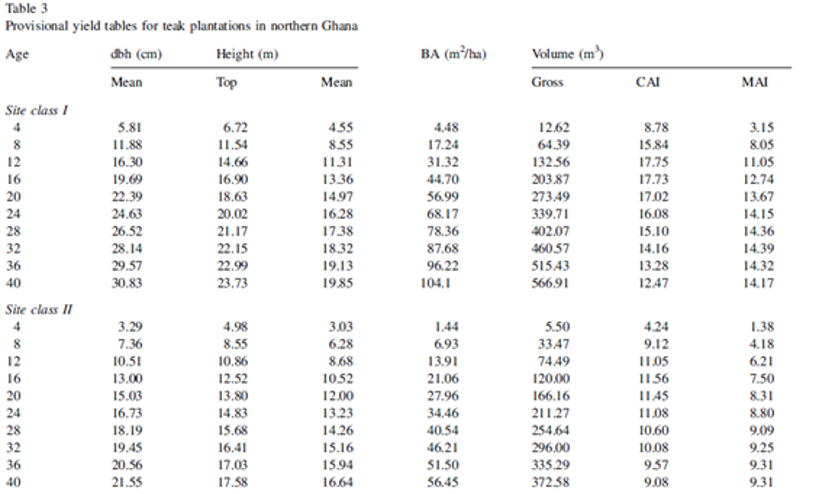
As we see in this table, we have two site classes (I and II), which stand for the quality of the sites, a forestry concept that represents the potential for trees to grow at a particular location, embedding in itself important factors for the growth of trees, such as soil fertility and depth.
Advantages:
Disadvantages:
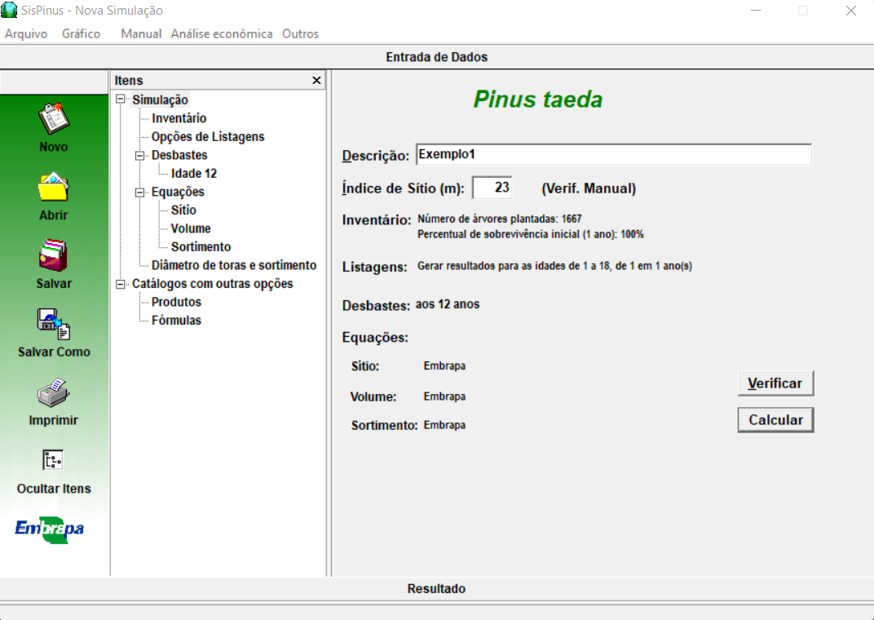
When yield tables are not available for a region, there are various software tools available that simulate forest growth. These models take into account variables like initial tree density and thinning practices to predict carbon sequestration over time.
Examples include Capsis, from CIRAD (mainly focused on Europe), MYRLIN, from Oxford Forestry Institute (available for 200 species) and the SIS softwares, from Embrapa (with a focus on Brazil, but adaptable to other tropical regions).
Advantages:
Disadvantages:
For most mixed forest restoration and agroforestry projects in tropical regions, yearly data on carbon sequestration is very scarce and virtually non-existent. Therefore, one possibility in these cases is looking for published data in scientific literature.
There are several papers assessing carbon sequestration in different types of vegetation and planting designs. However, differently from the previous 2 methods, they only refer to a static moment and usually don’t accompany the same area over time. For example, Nijmeijer et al. (2018) measured carbon from different cacao agroforests with different ages in Cameroon. If we plot this data with other published data (such as Saj et al. (2017) and Norgrove & Hauser (2012)), we can have an idea of the carbon potential in function of time.
Below, an example of employing this method – we can see that cacao agroforests in Cameroon hardly will sequester more than 500 tCO2/ha (aboveground + belowground biomass) according to data points obtained in published papers.

To adjust those points into a continuous curve that will provide estimations of available carbon credits yearly, several equations could be used, including the logistic, Lundqvist-Korf, Hossfeld and/or Chapman-Richards equations. According to recent literature (Bukoski et al., 2022), Chapman- Richards provides a good representation as it provides biologically meaningful growth parameters (S-shaped curve) of carbon accumulation, and this is the one we suggest using for this method.
Advantages:
Disadvantages:
Among all the methods presented here, this is the one that has the highest uncertainty and that most tends to overestimate carbon sequestration. It’s best used for mixed plantation projects that employ species for which there is little or no existing growth information.
In these cases, we need to use two strategies:
1 – Model the growth of individual trees each year.
2 – Use allometric equations to calculate tree volume and biomass. There are several sources of allometric equations for a wide range of species, such as the GlobAllomeTree and allometric package on software R.
Obtaining accurate data to model the growth of individual trees tends to be the tricky part. For species with little information, the available data can be unreliable, as factors like tree density (how closely trees are planted) and tree age might not be considered.
Let’s look at an example: In some of our restoration projects in West Africa, we want to plant Antiaria toxicaria, an important local tree species with very little growth data available. The only information we found comes from a database called Prota4u, which suggests that under good conditions, this tree can grow about 50 cm in height per year and about 1 cm in diameter. If we use this growth rate, we could predict that after 40 years, the tree would be about 20 meters tall and 40 cm in diameter. Then, we should just apply an allometric equation to calculate the tree’s volume and convert it to carbon (tCO2 equivalent). In theory, it seems simple, right?
However, using an allometric equation from research, we find that after 40 years, a single tree could store around 1.78 tons of CO2. If we plant 1,111 trees per hectare (at a spacing of 3 meters by 3 meters), we’d get around 1,977 tons of CO2 per hectare over 40 years. For comparison, tropical rainforests in Africa store about 700 tons of CO2 per hectare, so our projected figure seems very high.
So, where’s the catch here? And how have we ended up with such a high number if we’re using, in theory, good data?
The issue lies in the assumptions about tree growth. The data we used assumes that the trees will grow in an ideal environment, with no competition from other trees. However, when trees are planted close together, they do compete for resources like water, sunlight, and nutrients. This means they will likely grow slower and have smaller diameters than predicted, especially when planted at high densities. The growth data we used probably reflects trees growing in sparse conditions, not in a dense forest stand.
As a result, this method can be a trap because it overestimates the amount of carbon credits a project will generate over its lifetime.
Advantages:
Disadvantages:
As this post illustrates, estimating carbon from a reforestation project is not always a simple task. It requires a good understanding of forest dynamics, silviculture, ecology and sometimes even programming. Therefore, it is crucial to proceed with meticulous care at every stage to avoid unpleasant surprises to the investment in the future.
At hummingbirds, our team has extensive experience in developing carbon ex-ante estimations, having created more than 50 models for forest restoration, timber production and agroforestry in different geographies, including Latin America, Sub-Saharan Africa, Southeast Asia and Europe.
If you have a reforestation project and want to know its potential for carbon credit generation, please do not hesitate to contact us!
